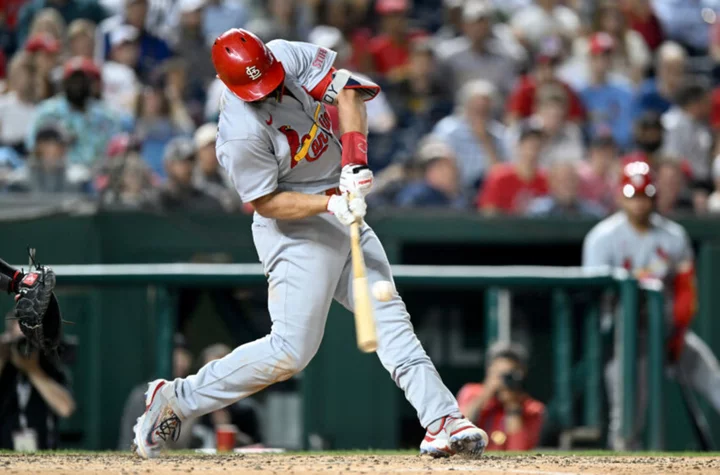
The Atlanta Braves and St. Louis Cardinals are at opposite ends of the MLB standings, but both teams are cracking bats at the plate.
The Aug. 1 trade deadline is just over a week away, which means every team is keeping an especially close eye on the MLB standings. While some teams sit comfortably atop their division — lookin' at you, Atlanta Braves — most are fending off the competition with some level of urgency.
Beyond that, there's a heated wildcard race unfolding in both the American League and the National League. The expected contenders are looking to cement their reputation; the up-and-comers are looking to shock the world.
As the proper MLB standings continue to ebb and flow, our focus today rests on hard hit rate — the percentage of a team's hits that leave the bat at 95 MPH or faster. Naturally, the higher the hard hit rate, the more power behind a team's bats.
MLB standings: Divisional standings ordered by hard hit percentage
NL East
- Atlanta Braves (46.3)
- New York Mets (40.9)
- Philadelphia Phillies (40.1)
- Miami Marlins (38.0)
- Washington Nationals (35.2)
No real surprises here. The Braves have the most potent lineup in the MLB right now. The Phillies would probably land a few ticks higher if Bryce Harper were operating at his usual level of power, but he has been slow of the gates since returning from Tommy John surgery. The Mets probably wish the power of Pete Alonso and others contributed to more wins, but alas… it hasn't.
NL Central
- St. Louis Cardinals (43.4)
- Pittsburgh Pirates (40.8)
- Chicago Cubs (38.4)
- Milwaukee Brewers (38.3)
- Cincinnati Reds (34.7)
Elly De La Cruz is doing his absolute best to get the Reds' number up, but Cincy is still lagging far behind despite the team's recent surge in the win column. As for St. Louis, this is hardly unexpected — just look at the power concentrated in that lineup — but the team is 11 games below .500, which leaves one question for fans: why hasn't it translated to wins?
NL West
- Los Angeles Dodgers (42.0)
- San Francisco Giants (40.2)
- San Diego Padres (39.7)
- Arizona Diamondbacks (38.1)
- Colorado Rockies (36.3)
The Dodgers continue to reap the benefits of expensive summers past. Mookie Betts and Freddie Freeman anchor the NL's second most potent lineup, with the potential for that lineup to receive a considerable boost of the Angels decide to ultimately move Shohei Ohtani before the trade deadline.
AL East
- Toronto Blue Jays (41.5)
- Tampa Bay Rays (41.3)
- New York Yankees (41.1)
- Baltimore Orioles (40.7)
- Boston Red Sox (39.2)
The AL East is the most competitive division in baseball. The Orioles recently surpassed the Rays for No. 1 in the real standings, but there's power across the board here. The Yankees might be an Aaron Judge injury away from the top spot in these standings.
AL Central
- Minnesota Twins (41.5)
- Detroit Tigers (41.4)
- Kansas City Royals (41.1)
- Chicago White Sox (38.0)
- Cleveland Guardians (33.1)
The Guardians are 2.0 games out of first place, but they're the least powerful team in the MLB by hard hit rate. The Royals, meanwhile, are getting a lot of pop off the bat and translating it to precious few runs on the board.
AL West
- Texas Rangers (42.1)
- Seattle Mariners (41.6)
- Los Angeles Angels (41.5)
- Houston Astros (38.7)
- Oakland Athleitcs (33.3)
Of course the Rangers are No. 1 here, but it's surprising to see the Astros so low after years of unprecedented power from that lineup. Injuries probably play a big role here. The Angels have the best power hitter in the world right now; if Ohtani gets traded, expect the Angels to drop precipitously down the hard hit rate standings and the real standings.
MLB standings: League standings ordered by hard hit percentage
National League
- Atlanta Braves (46.3)
- St. Louis Cardinals (43.4)
- Los Angeles Dodgers (42.0)
- New York Mets (40.9)
- Pittsburgh Pirates (40.8)
- San Francisco Giants (40.2)
- Philadelphia Phillies (40.1)
- San Diego Padres (39.7)
- Chicago Cubs (38.4)
- Milwaukee Brewers (38.3)
- Arizona Diamondbacks (38.1)
- Miami Marlins (38.0)
- Colorado Rockies (36.3)
- Washington Nationals (35.2)
- Cincinnati Reds (34.7)
The Cardinals have been in this conundrum all season: plenty of indicators suggesting they should be good, but not nearly enough tangible progress in the win column to suggest the team is actually good. Now with the Aug. 1 trade deadline forthcoming, it wouldn't be surprising if the front office initiates major change. Oh, what could have been.
American League
- Texas Rangers (42.1)
- Seattle Mariners (41.6)
- Los Angeles Angels (41.5)
- Minnesota Twins (41.5)
- Toronto Blue Jays (41.5)
- Detroit Tigers (41.4)
- Tampa Bay Rays (41.3)
- New York Yankees (41.1)
- Kansas City Royals (41.1)
- Baltimore Orioles (40.7)
- Boston Red Sox (39.2)
- Houston Astros (38.7)
- Chicago White Sox (38.0)
- Oakland Athletics (33.3)
- Cleveland Guardians (33.1)
The American League is top heavy in the power department, with seven of the top 10 teams in hard hit rate. The basement, however, belongs to the American League as well. Oakland and Cleveland are lagging well behind the pack when it comes to pop off the bat.

